Output files
Overview
The default output of the program is a heatmap and the corresponding data as an XLSX spreadsheet.
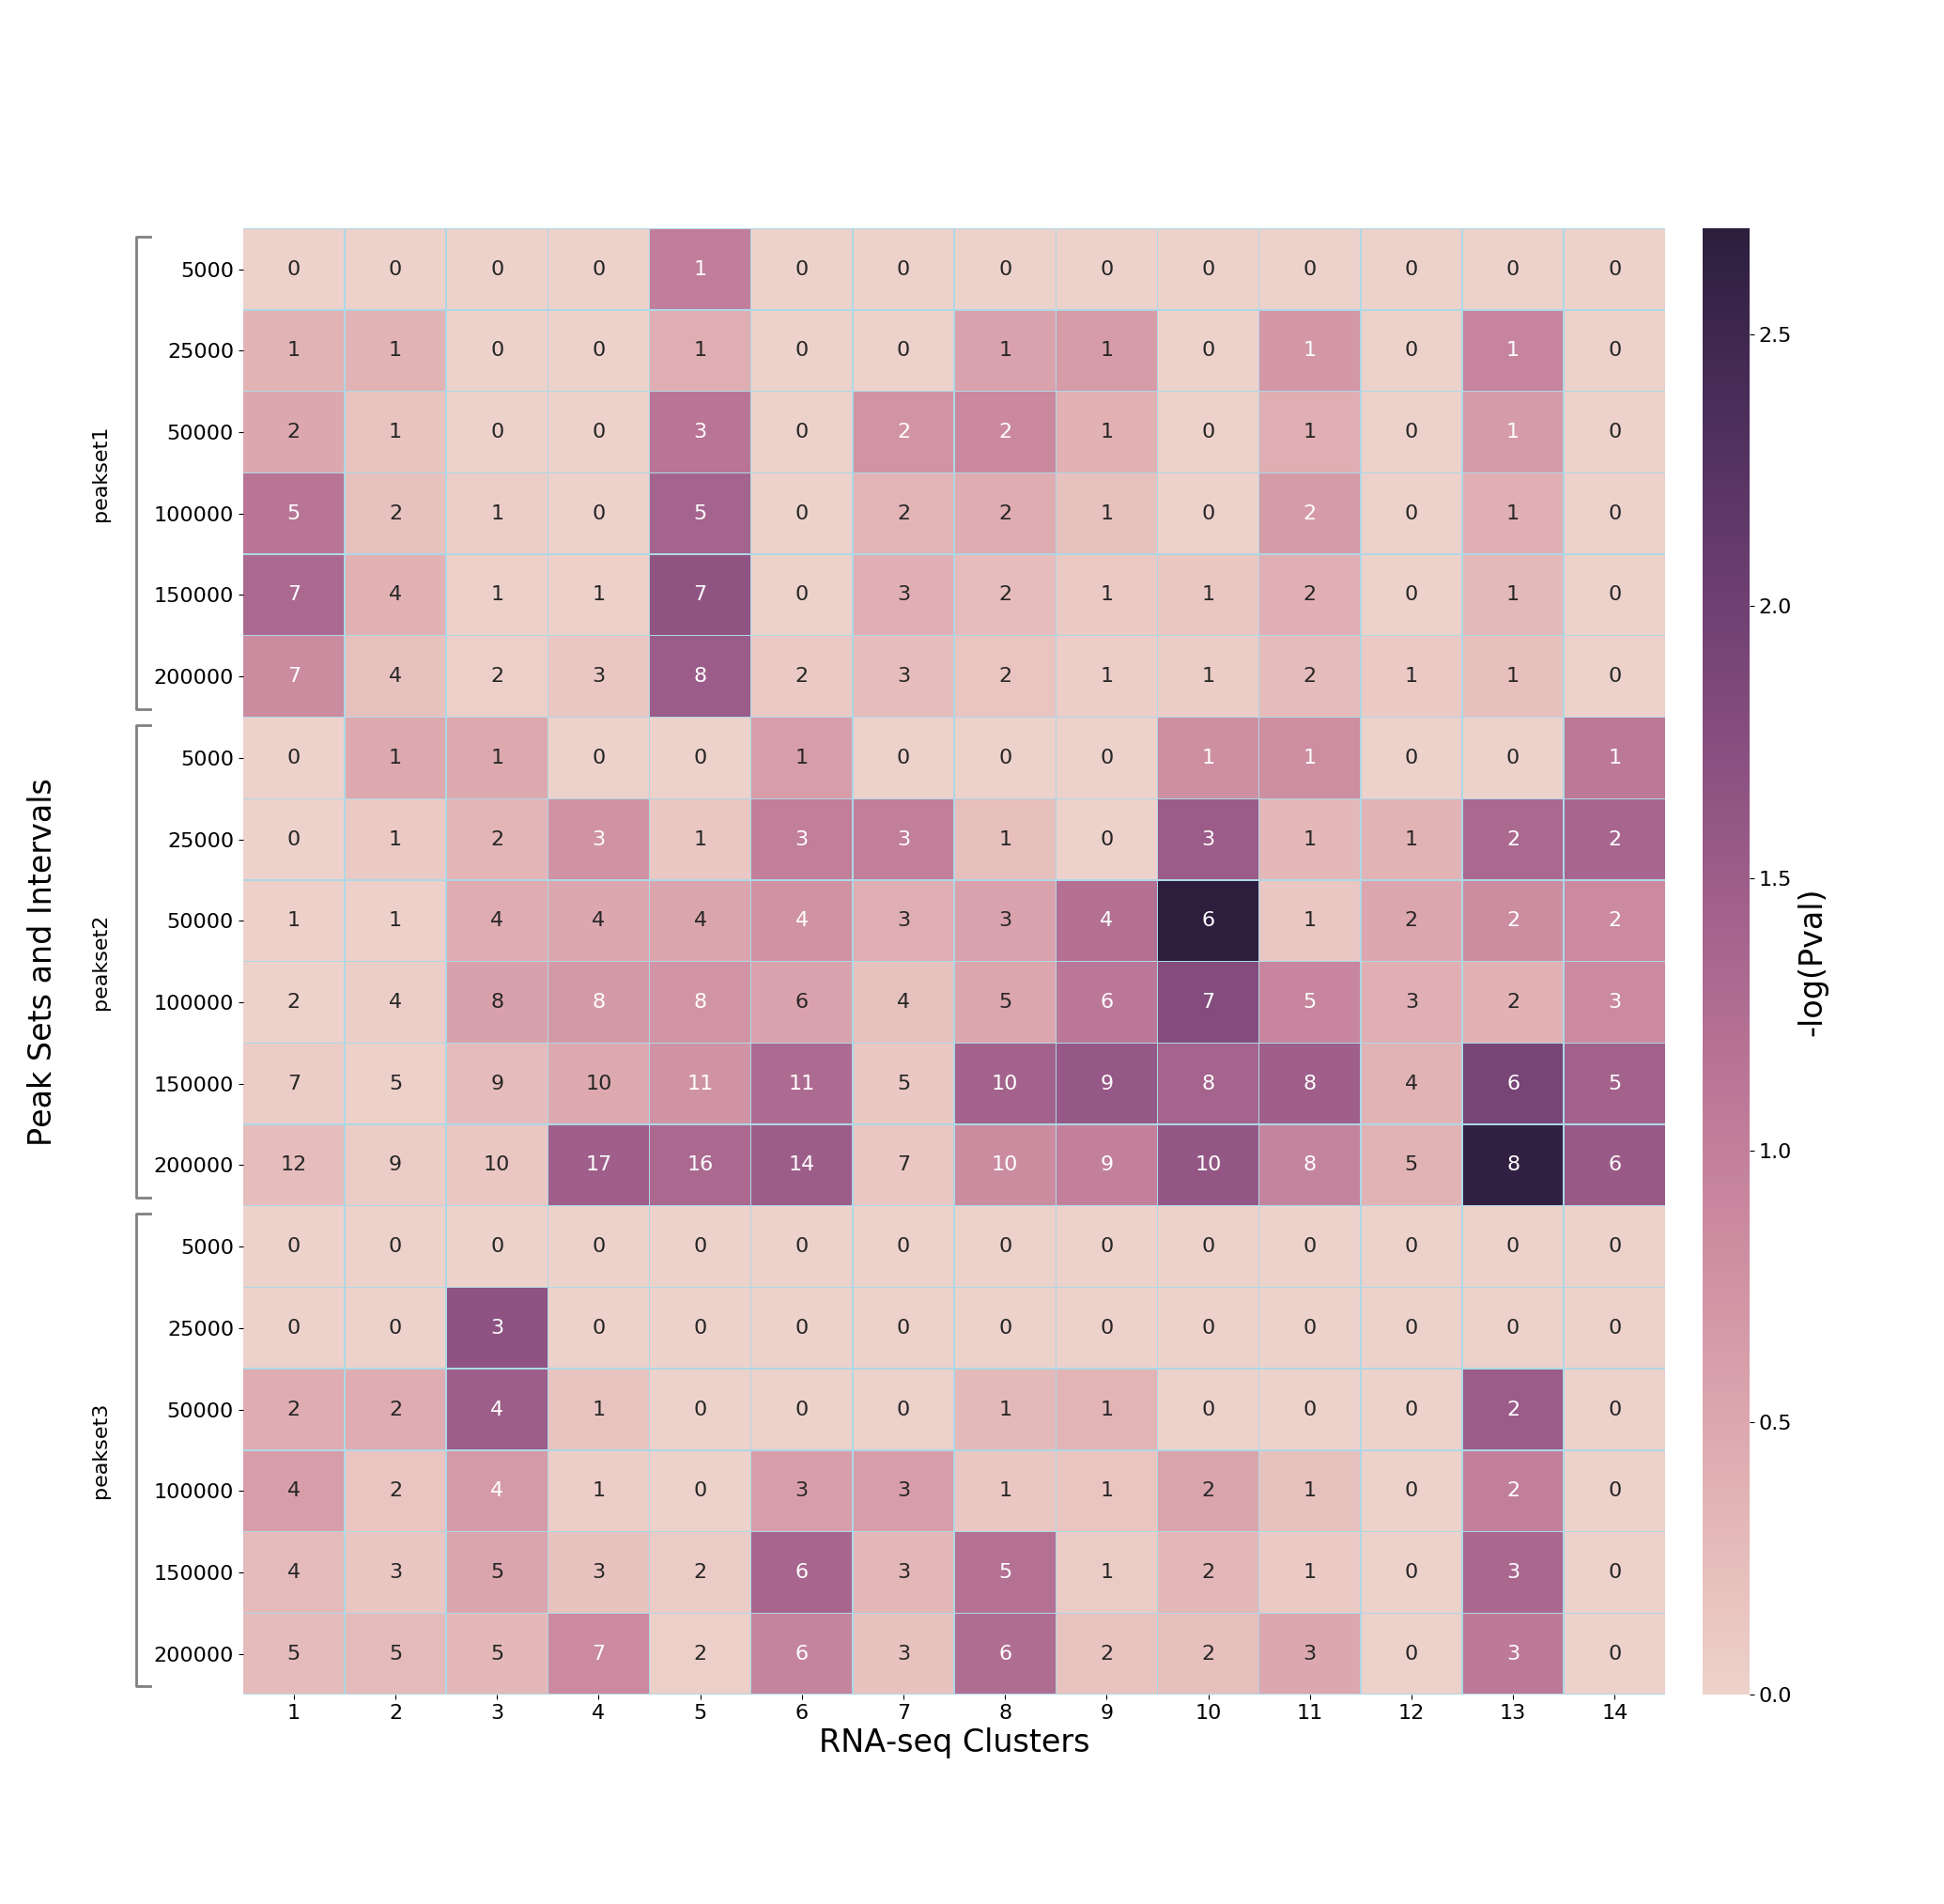
Heatmap
In the heatmap, x-axis are the gene clusters, and y-axis show peak-sets expanded to different genomic distances.
The cell color represents -log10(p-value) of enrichment, and annotation of cells are the number of common genes for that particular combination of gene cluster (x-axis) and gene-set derived from the expanded peak-set (y-axis). For example:
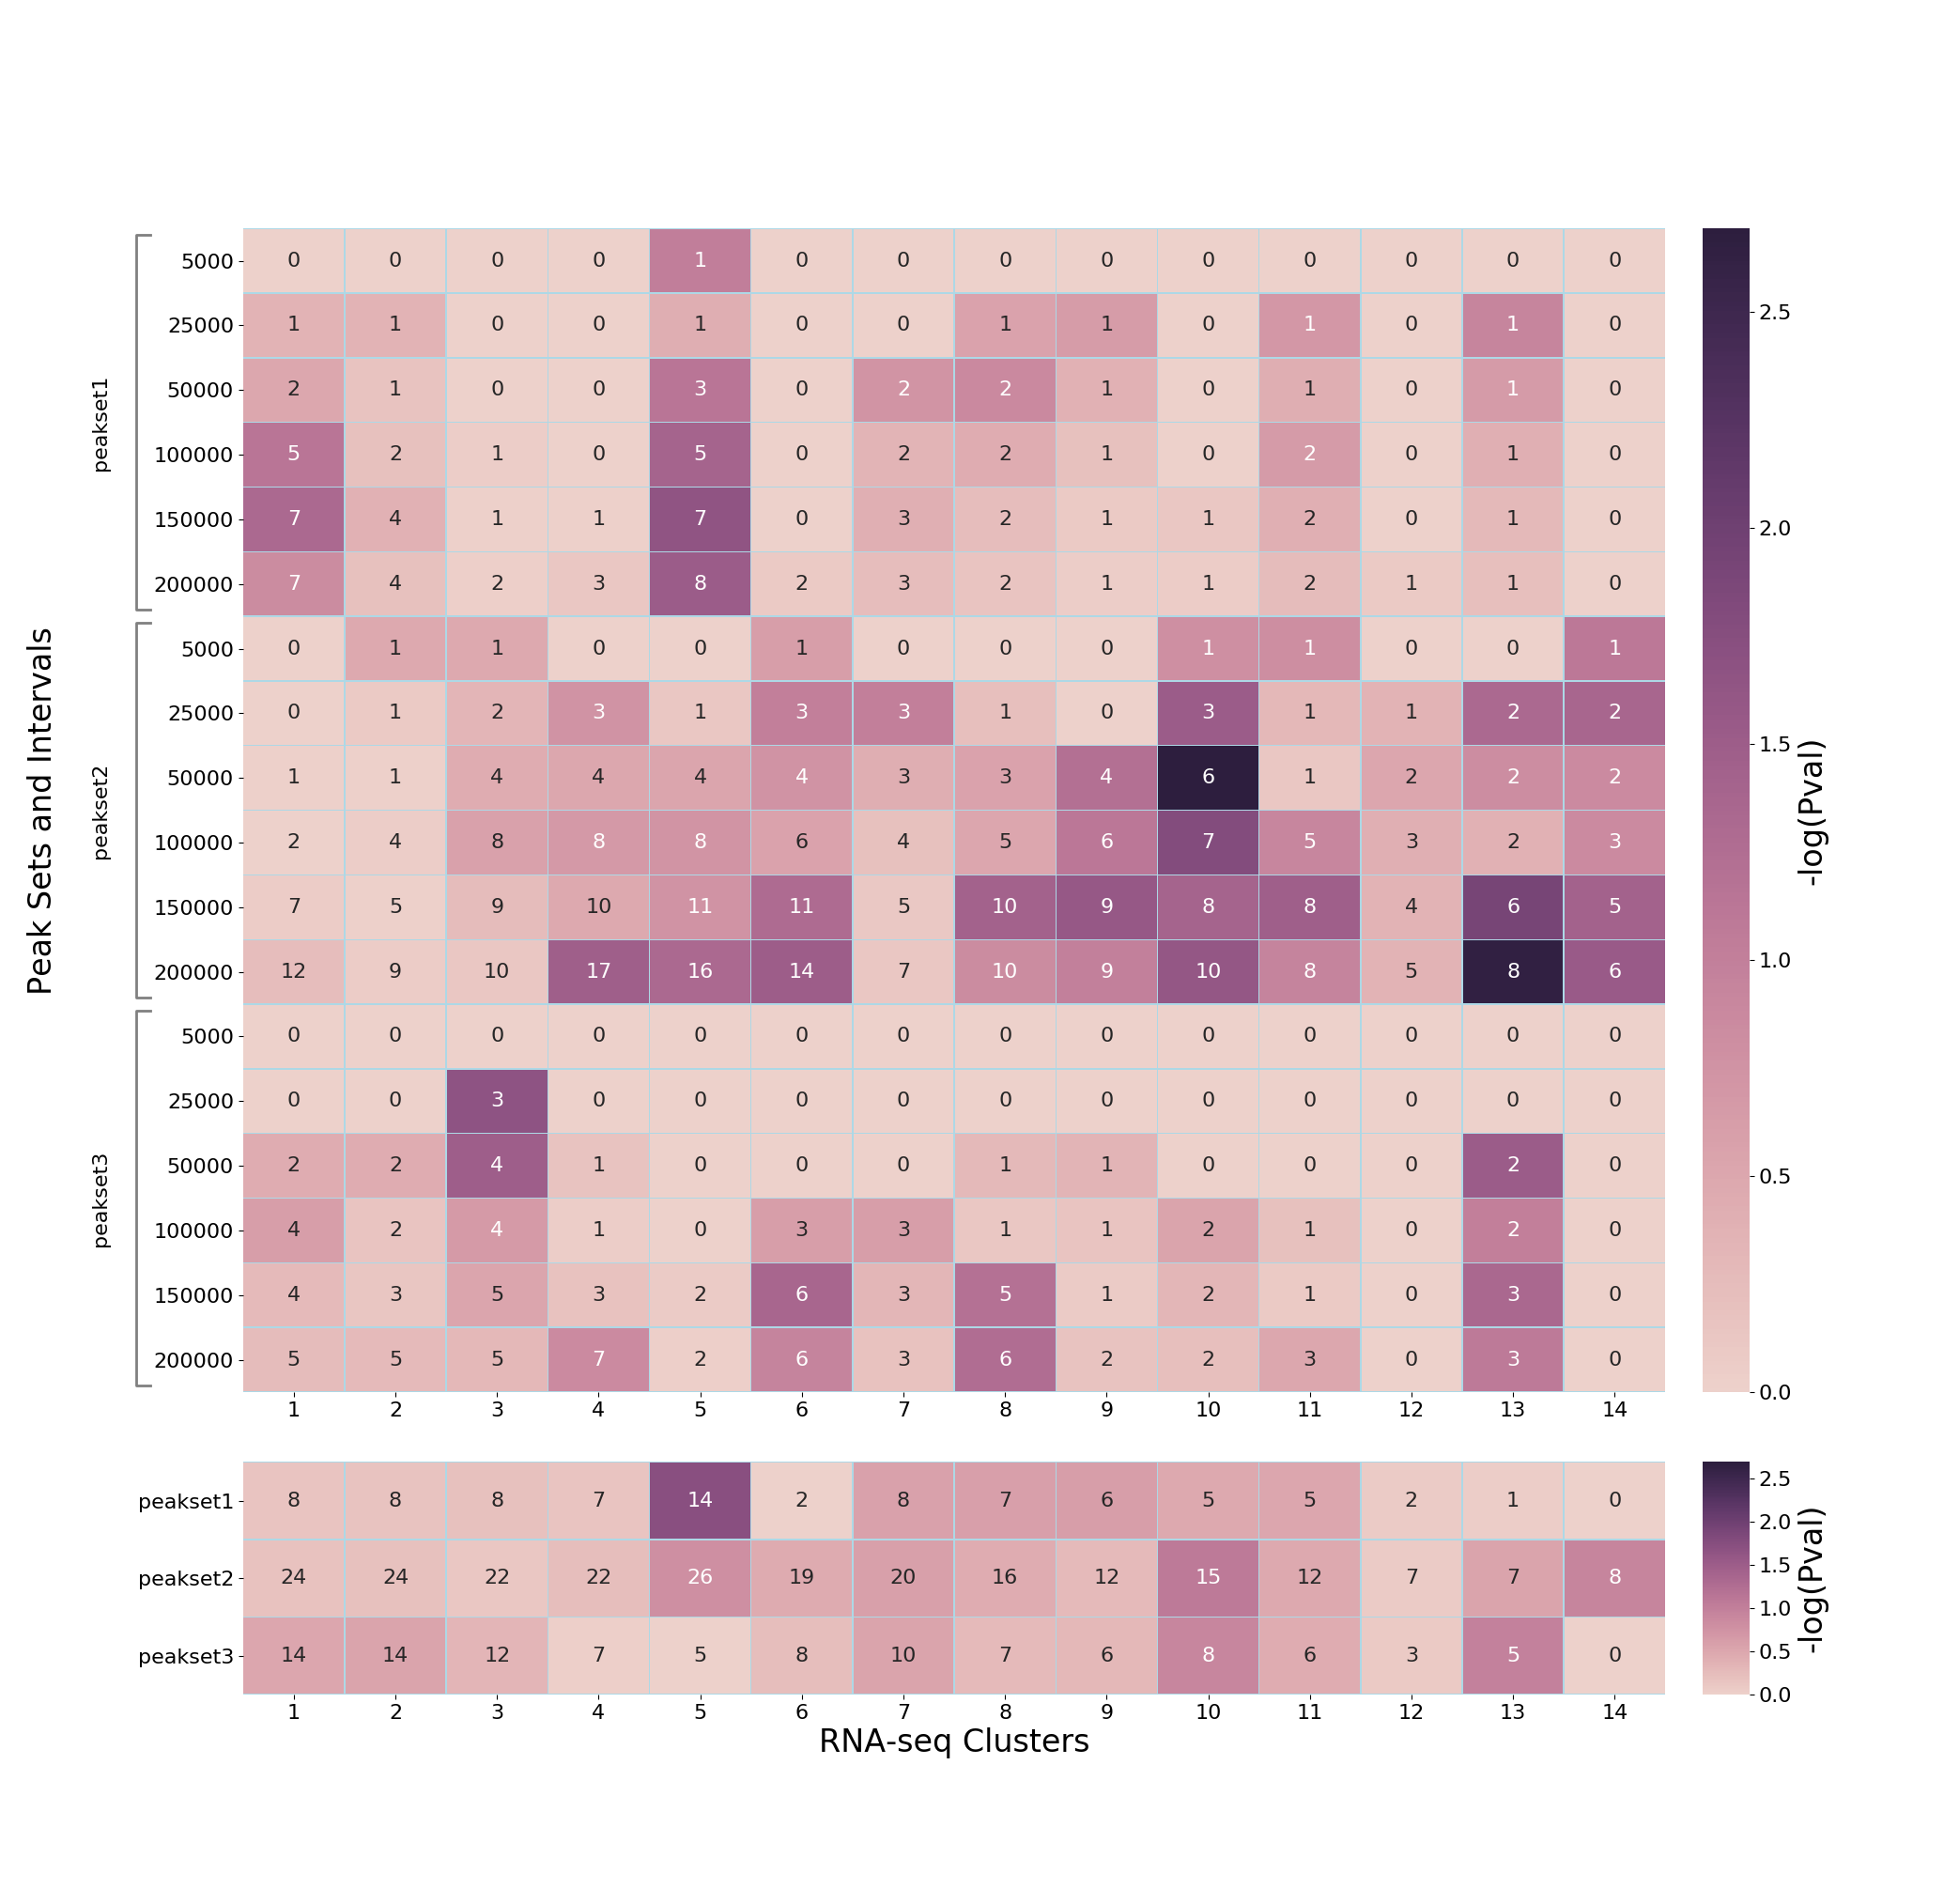
If TADs are used, then the additional subplot at the bottom shows similar enrichment as above, but without individual distances for peak-sets (because each genomic interval is expanded to distance/bounary defined in the TADs BED file). For example:
By default the heatmap is output as a PNG image, however this can be changed (along with other properties of the heatmap such as colours and axis labels) as described in Customising the heatmap.
XLSX file
This spreadsheet includes all the data (including p-values, and common genes) used to generate the heatmap; for example:
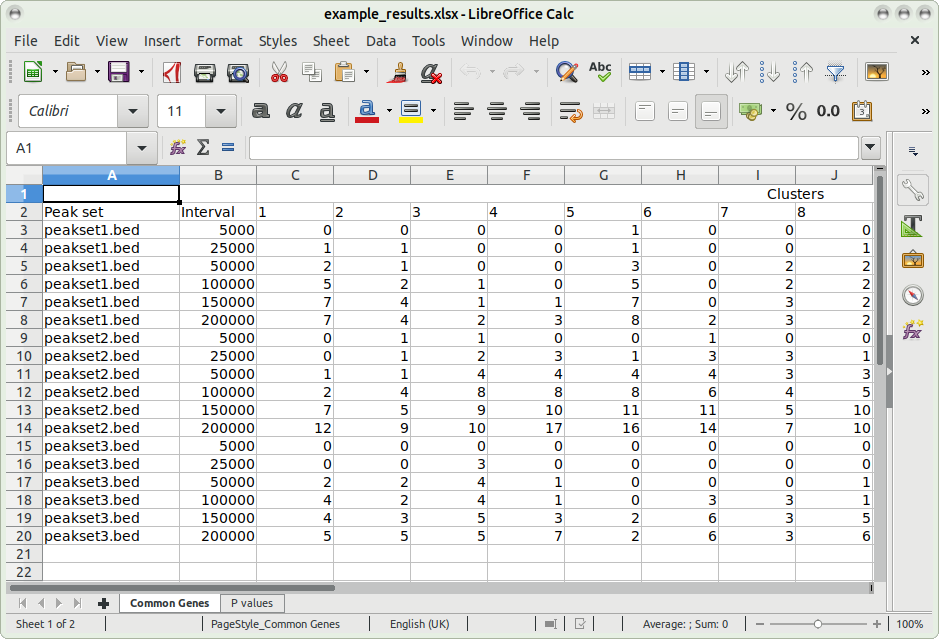
Note that as all the data used in the heatmap is also output to the XLSX file, the user can use this to build their own custom heatmaps.
Optional outputs
Intersection files
By default the program removes all working data on successful
completion, however it is possible to keep the intermediate
intersection files by specifying the -k
(--keep-intersection-files) option. The intersection files
will be written to the directory intersection_beds.
These files are generated by intersecting the expanded peak-set
BED file (for a given distance) and the GENE_INTERVALS input
file (reference gene intervals file for all genes). They can be
used for further analysis, for example finding common gene names
and overlapping peaks, which can be used for motif enrichment etc.
Raw p-value and count data
These can be output using the --dump-raw-data option.